On this page, B Sc. Viktor shares some background information on how we got the data for our popular experiment “How to double your confidence in 5 minutes”.
In the experiment, we showed that it is possible to more than halve someone’s stress levels in a conversation with a stranger after 5 minutes of coaching. (And then almost double them again using our “anti-coaching”).
In 2007, scientists showed that they could make people feel significantly less nervous in a conversation with a stranger. They simply instructed the participants to focus on the person they were talking to, compared to focusing inwards ref 1.
In that experiment, the researchers let the participants report on a scale of 0 to 10 how nervous they had felt.
We wanted to make an improved version of this test by measuring the actual stress levels. We use the scientific standard method to measure stress levels, called Heart Rate Variability or HRV ref 2.
Explanation of Fanny’s stress diagram
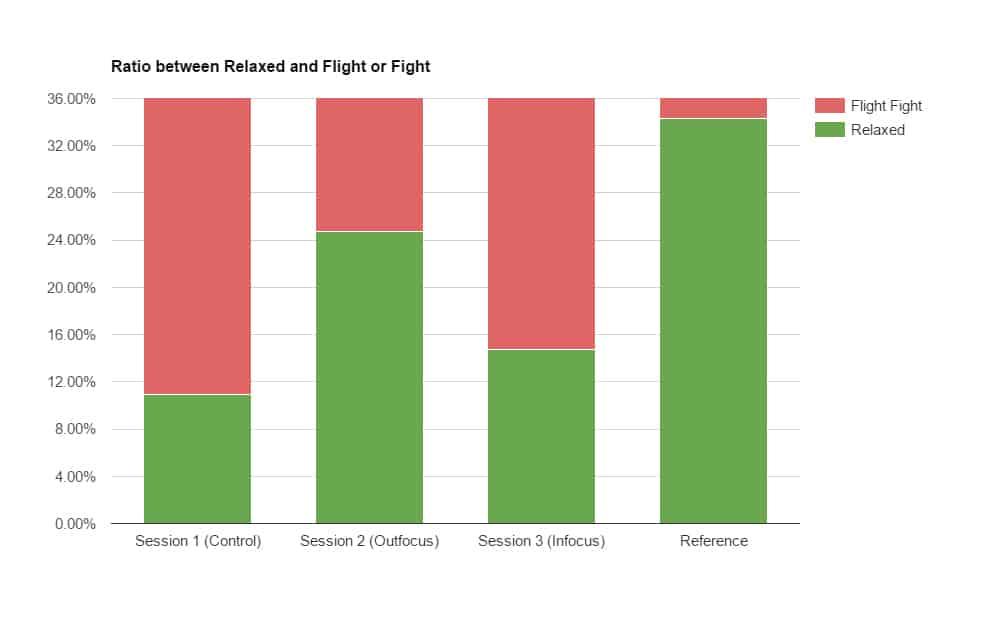
Here’s the diagram from the video. It shows Fanny’s ratio between her flight-or-fight system and relaxed system during the different conversations. The scientifically correct names are the sympathetic nervous system (Flight-fight) and parasympathetic nervous system (rest).
The more active the sympathetic nervous system is in relation to the parasympathetic nervous system, the more stressed you are ref 3.
So, how do you measure this relation?
It turns out that the variability of one’s heart rate (HRV) accurately signals the ratio between the two nervous systems.
We used the Polar H7 heart rate monitor to accurately measure HRV. We used this model as independent testing has shown that it has a level of accuracy on par with professional ECG machines used in hospitals ref 4. Fanny wore this device during the conversations.
HRV is divided into two frequencies. One high frequency (HF) and one low frequency (LF). HRV-HF corresponds to parasympathetic activity and HRV-LF corresponds to parasympathetic AND sympathetic activity. This means that you can single out the parasympathetic system by dividing HRV-HF with HRV-LF, which we did.
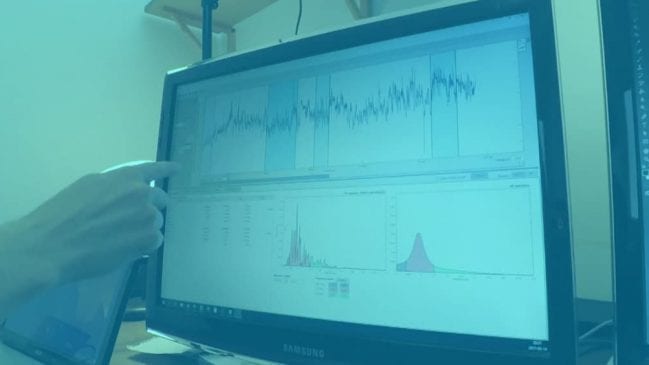
We imported the data into Kubios HRV, a software used by researchers to accurately analyze HRV.
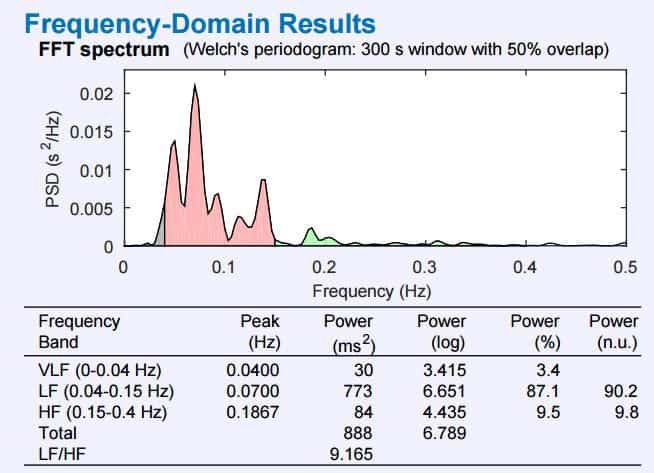
Here’s the HRV reading during the first session. Fanny’s HRV HF (The “calm” HRV) is 11% of the HRV LF.
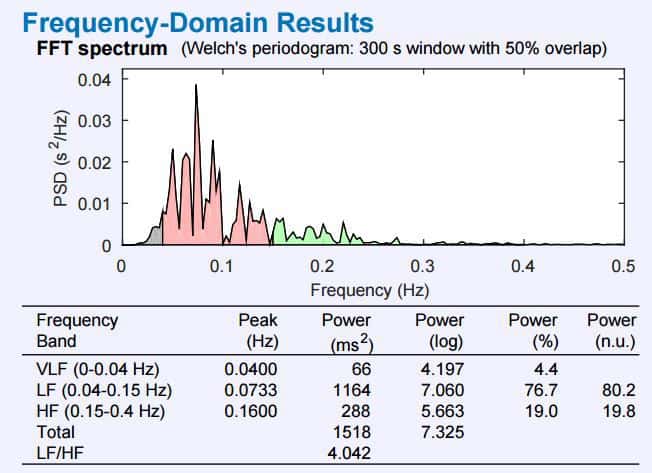
Here we can see the second session. The “calm” HRV-HF is now 25% of the HRV LF. It means her parasympathetic state (or rest state) has more than doubled!
We then simply moved these numbers to a diagram to be able to easily compare them with her reference conversation: A conversation she had with a person she’d known for many years.
You can see the full data from all sessions from Kubios, and also the direct link to the diagram and its calculation.
Fancy data analysis aside, how did Fanny actually FEEL?
So the readings showed that Fanny’s relaxed state indeed doubled. But what about how Fanny actually FELT?
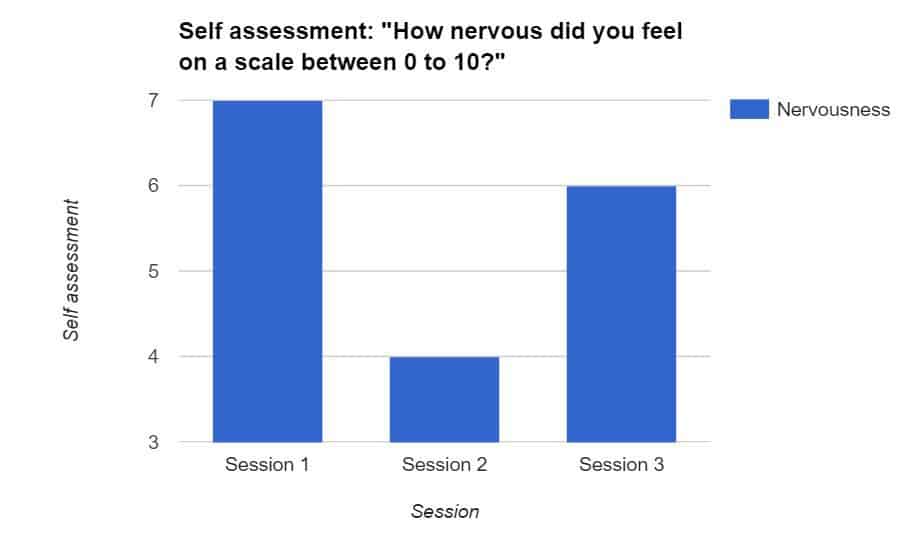
After each session, we asked her to write down on a scale between 0 to 10 how nervous she had felt. The first session, she rated herself as a 7. After David’s coaching, she rated herself at 4. After the “anti-coaching”, she rated herself as a 6 (Despite believing that this anti-coaching was supposed to make her LESS nervous).
In other words: Fanny’s self-assessment was consistent with the HRV readings.
References
- Zou JB, Hudson JL, Rapee RM: The effect of attentional focus on social anxiety
- Logier et al: Comparison of pulse rate variability and heart rate variability for high-frequency content estimation
- Kim, H. G., Cheon, E. J., Bai, D. S., Lee, Y. H., & Koo, B. H. (2018). Stress and Heart Rate Variability: A Meta-Analysis and Review of the Literature. Psychiatry investigation, 15(3), 235–245. https://doi.org/10.30773/pi.2017.08.17
- Independent comparison between Polar H7 and medical grade ECG monitor